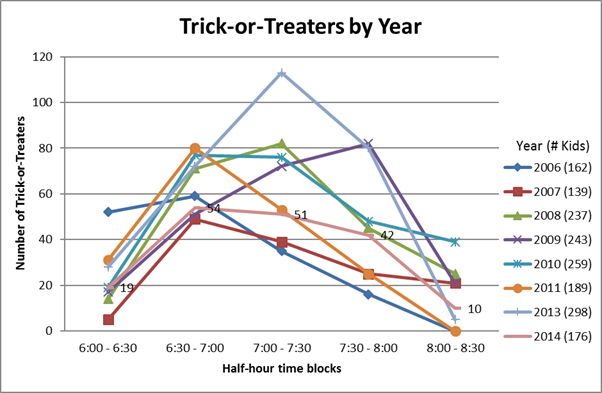
176 Trick-or-Treaters
It was raining this year and I think that put a damper on the trick-or-treat count. We also didn’t put out our “Halloween projector” that puts a festive image on our garage, so I think the rain, combined with lack of decor, resulted in quite a bit fewer kids showing up. When it was busy, it was really busy; but when it wasn’t… it was dead.

The graph is starting to look like a big mess so I will probably start keeping more like “the last five years” on there. I’ll also keep an overall average graph to keep the bigger picture.

The table’s also starting to get pretty wide; might have to switch it so time block goes across the top and year goes down.
Cumulative data:
| Year | ||||||||
|---|---|---|---|---|---|---|---|---|
| Time Block | 2006 | 2007</th> | 2008</th> | 2009 | 2010 | 2011 | 2013 | 2014 | </tr> </thead>
| 6:00p - 6:30p | 52 | 5 | 14 | 17 | 19 | 31 | 28 | 19 |
| 6:30p - 7:00p | 59 | 45 | 71 | 51 | 77 | 80 | 72 | 54 |
| 7:00p - 7:30p | 35 | 39 | 82 | 72 | 76 | 53 | 113 | 51 |
| 7:30p - 8:00p | 16 | 25 | 45 | 82 | 48 | 25 | 80 | 42 |
| 8:00p - 8:30p | 0 | 21 | 25 | 21 | 39 | 0 | 5 | 10 |
| Total | 162 | 139 | 237 | 243 | 259 | 189 | 298 | 176 |