Secure Public Internet with Synology VPN and Proxy
A few months back Cory Doctorow stopped by the local library and did a great talk on security and copyright issues. Very cool stuff which inspired me to look into how to secure my public/open wifi usage.
I have a Synology DS1010+ with a ton of helpful packages and features on it, so that seemed like the best place to start. It took a while, but I got it. I’m going to show you how.
Truly, Synology has made this super easy. I’m not sure this would have been something I could have done nearly as easily without that device and the amazing Diskstation Manager “OS” they have on it. If you haven’t got one of their NAS devices, just go get one. I’ve loved mine since I got it and it just keeps getting more features with every DSM release they put out.
So, with that, the general steps are:
- Set up user accounts on your Synology NAS.
- Make your Synology NAS publicly accessible.
- Add a proxy server to the NAS.
- Add VPN support to the NAS.
- Make sure the firewall and router allow the VPN to connect.
- Configure your client (e.g., phone) to use the VPN and proxy.
I’ll walk you through each step.
Don’t skim and skip steps. I can’t stress this enough. Getting this up and running requires some virtual “planets to align” as it were, so if you skip something, the process will break down and it is kind of tough to troubleshoot.
You need to set up user accounts for people accessing the VPN. Chances are if you have your NAS set up already, you have these accounts - these are the same accounts you use to grant access to NAS files and other resources. There is a nice detailed walkthrough on the Synology site showing how to do this.
Now you need to set up your Synology NAS so you can access it from outside your home network. This is accomplished through a service called “dynamic DNS” or “DDNS.” But you don’t really need to know too much about that because, built right into the DSM interface, is a program called “EZ-Internet” that will do all the work for you. For the easiest solution, you’ll need to set up a user account with Synology, but that’s free… and if you use their DDNS system (a “synology.me” domain name) then that’s also free. They have a really super tutorial on getting this set up. Focus specifically on the EZ-Internet part of the tutorial - the QuickConnect stuff is neat and good to set up, but it won’t work for VPN usage.
It took me something like (seriously) five minutes to get this part working from start to finish. Some of the steps may seem “scary” if you’ve not set it up before, but Synology has made this really painless and if you don’t know what to do, accept the defaults. They’re good defaults.
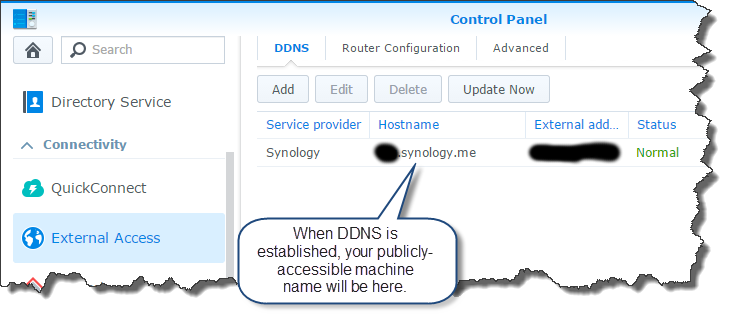
When that’s done, you’ll see your DDNS setup in the Synology control panel under “External Access.”
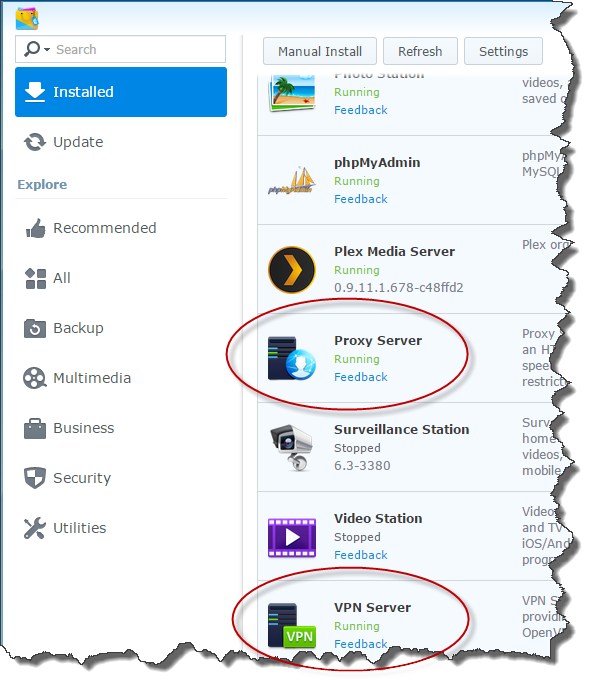
Next, install the Proxy Server and VPN Server packages using the DSM Package Station package manager. Installing packages is a point-and-click sort of thing - just select them from the list of available packages and click “Install.” Make sure you set them as “Running” if they don’t automatically start up. Once they’re installed, you’ll see them in the list of installed packages.
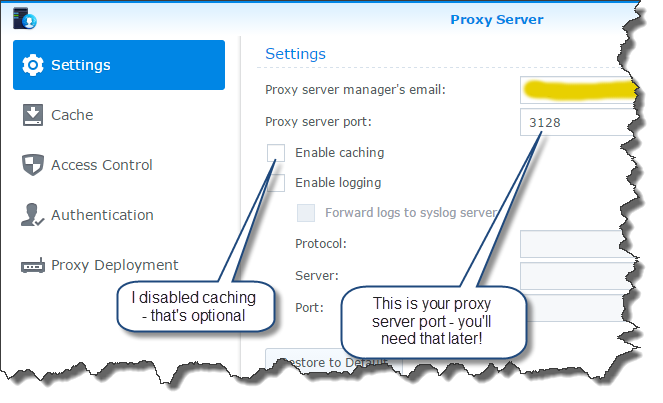
Let’s configure the proxy server. From the application manager (the top-left corner icon in the DSM admin panel) select the “Proxy Server” application. There isn’t much to this. Just go to the main “Settings” tab and…
- Put your email address in the “Proxy server manager’s email” box.
- Make a note of the “Proxy server port” value because you’ll need it later.
You can optionally disable caching on the proxy server if you’re not interested in your Synology doing caching for you. I didn’t want that - I wanted fresh data every time - so I unchecked that box. You can also optionally change the proxy server port but I left it as the default value provided.
Done with the proxy server! Close that out.
Now let’s configure the VPN server. This is a bit more complex than the proxy server, but not too bad.
Again from the application manager (the top-left corner icon in the DSM admin panel) select the “VPN Server” application.
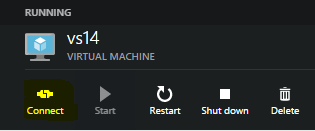
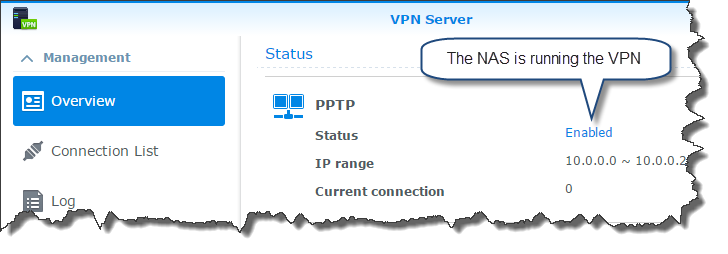
On the “Overview” pane in the VPN server you you will start out showing no VPNs listed. Once you’ve finished configuring the VPN, you’ll see what I see - the NAS running the VPN and the VPN showing as enabled.
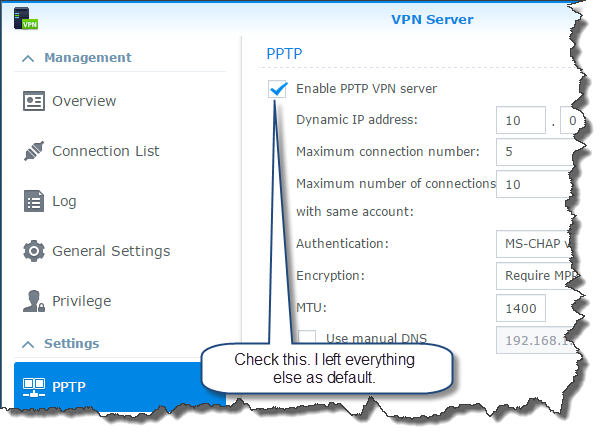
The VPN Server application offers several different VPN types to choose from. You can read about the differences on this article. I chose to use PPTP for my VPN for compatibility reasons - it was the easiest to get set up and running and I had some challenges trying to get different devices hooked up using the others. I am not specifically recommending you use PPTP, that’s just what I’m using. The steps here show how to set up PPTP but it isn’t too different to set up the other VPN types.
On the PPTP tab, check the “Enable PPTP VPN server” option. That’s pretty much it. That gets it working.
That’s it for the VPN configuration.
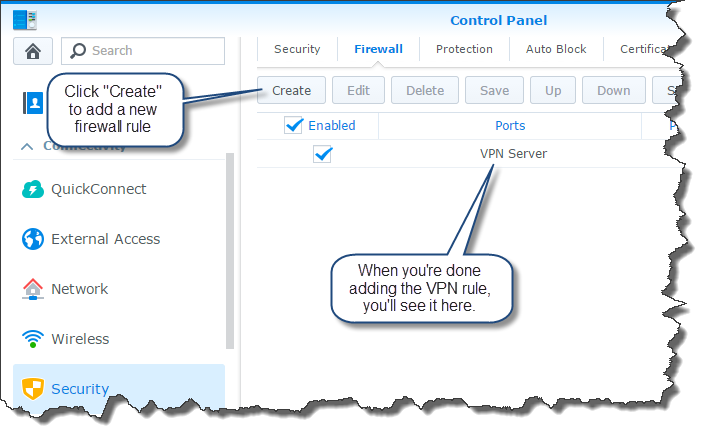
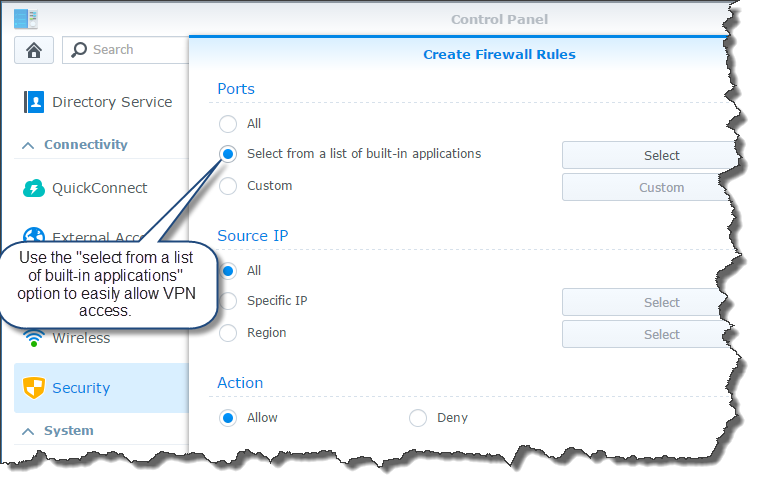
To allow people to connect to the VPN on the NAS, we need to set up the firewall on the NAS. In the Synology DSM control panel, go to the “Security” tab on the left, then select “Firewall” at the top. Click the “Create” button to create a new firewall rule.
When prompted, choose the “Select from a list of built-in applications” option on the “Create Firewall Rules” page. This makes it super easy - the DSM already knows which ports to open for the VPN server.
Scroll through the list of applications and check the box next to “VPN Server (PPTP)” to open the firewall ports for the VPN.
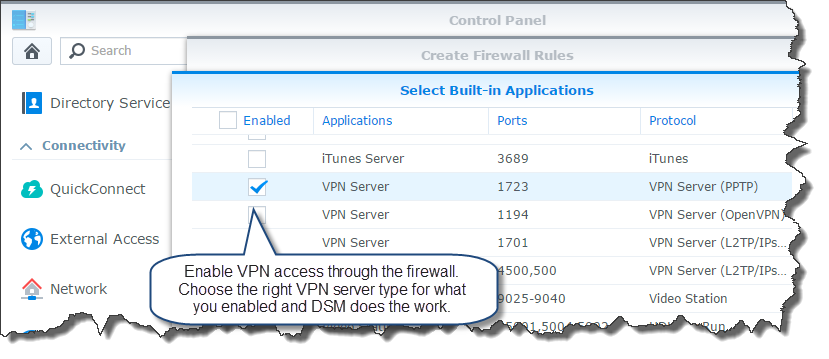
The firewall settings will be applied and you’ll see it in the list of rules.
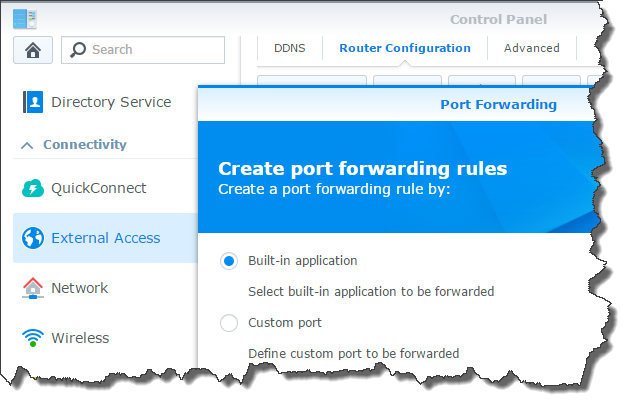
The last thing to do on the NAS is to set up the router port forwarding configuration. DSM can automatically configure your router right from the NAS to enable the VPN connection to come through.
In the DSM Control Panel, go to the “External Access” tab on the left and choose “Router Configuration” from the top. This is almost identical to the firewall configuration process. Click the “Create” button to add a new rule and you’ll be prompted to choose from a list of existing applications. Do that, and select the VPN server from the list.
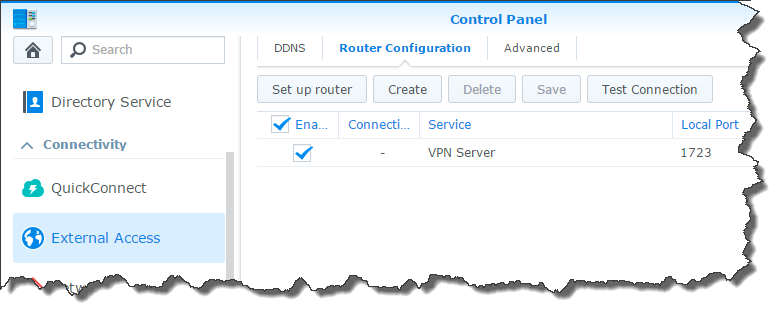
Once it’s configured, the DSM will issue some commands to your router and the rule will show up in the list.
That’s it for your server configuration! Now you have to connect your clients to it.
The rest of this walkthrough shows how I got my Android 4 phone connected to the VPN. I don’t have walkthroughs for other devices. Sorry.
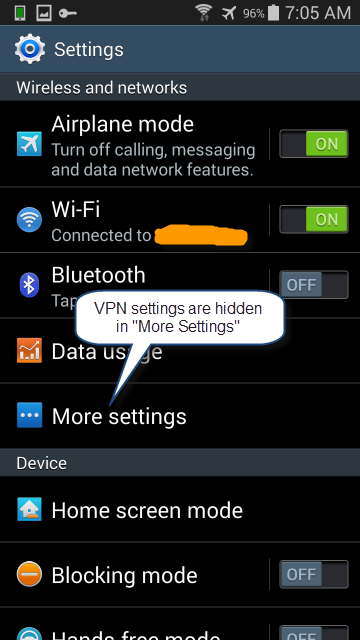
Go to the main settings screen. From here, you’re going to choose “More settings.”
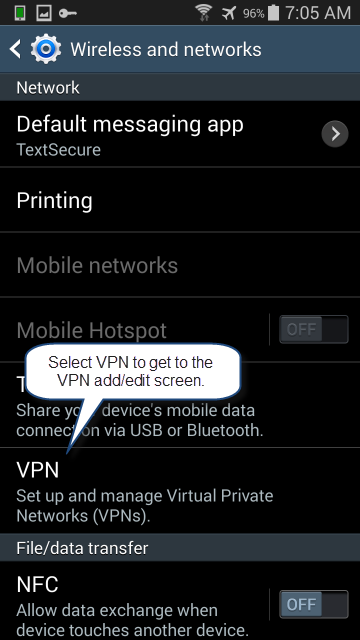
Scroll down to the VPN settings and click that.
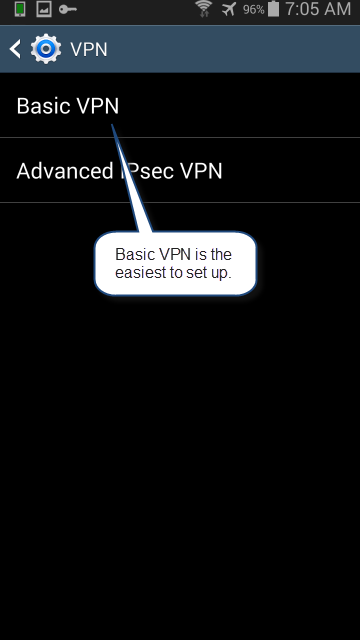
For a PPTP VPN, select “Basic VPN” from the list.
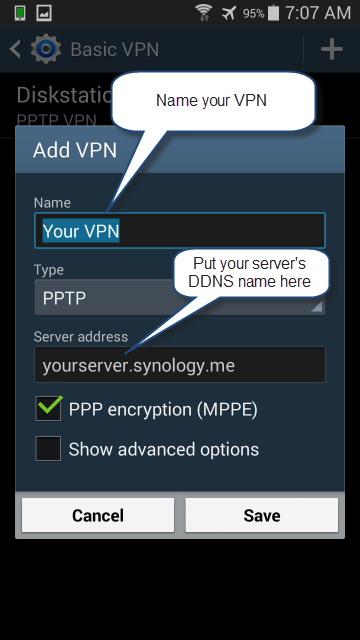
Give your VPN a memorable name and put the DDNS name for your server in the “Server address” box.
When you connect to the VPN you’ll be asked for a username and password. Use the username and password from your user account on the Synology NAS. (Remember that first step of setting up user accounts? This is why.)
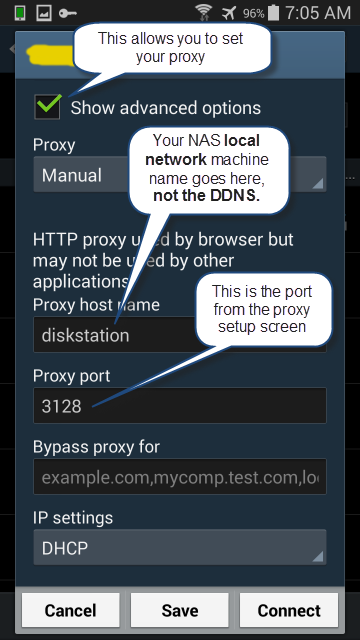
The last configuration step is to set the proxy server. Android 4 has this hidden inside the wifi configuration for each wifi hotspot. For the hotspot you’re connected to, edit the settings and check the “Show advanced options” box. Fill in the proxy details using the local machine name of your NAS (not the DDNS name) and the proxy server port you have configured.
Now connect to the VPN and the wifi hotspot at the same time. Go back through the Settings => More settings => VPN path to find the VPN you configured. Connect to it and if you haven’t previously set up credentials you’ll be prompted. Connect to the wifi hotspot as well so it’s using the proxy server.
When you’re connected to both the VPN and the hotspot with the proxy settings, things work! You will see a little “key” at the top of the phone showing you’re connected to a VPN. You can pull up some VPN details from there.
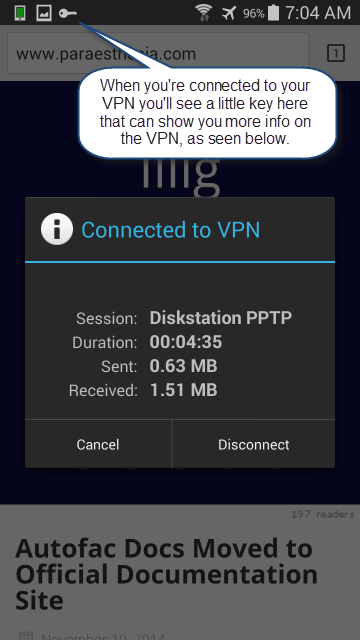
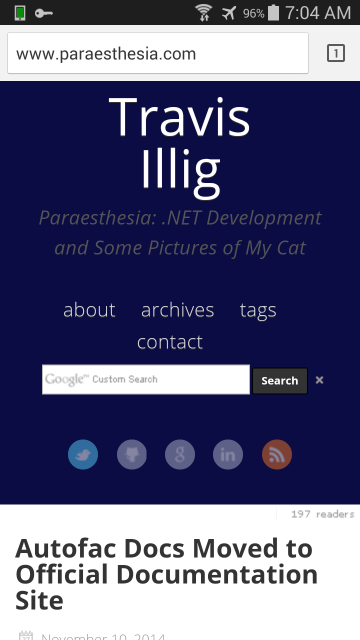
And here’s a screen shot of me surfing my blog through my VPN and proxy server, securely from an open wifi hotspot. Note the key at the top!
I’m still working out a few things and may change my setup as time goes on, but this is the easiest DIY VPN/proxy setup I’ve seen.
Stuff I’d like to do next…
- Switch from PPTP to a different VPN type (or maybe offer more than one VPN type so I can be compatible with devices requiring PPTP but offer better security for devices that can handle it).
- Figure out if caching helps. I’ve found that some stuff is pretty fast, but other stuff is slow (or doesn’t flow quite right through the proxy). I’m not sure why that is. Maybe additional proxy settings I’m not aware of yet?
And, finally, again - thanks to Cory Doctorow for prodding me into researching this; and thanks to Synology for making it easy. Part of what Doctorow was saying at his visit is that Security is Hard, particularly the implementation of decent security for the lay person. Synology is as close to point-and-click easy setup as I’ve ever seen for this.
If you’re looking for one of these devices, the Synology DS214se is pretty budget-friendly right now, though the Synology DS414j might give you a little room to grow. I have the DS1010+, which is basically the previous model of the Synology DS1513+, which is more spendy but is super extensible. All of the Synology products run the DSM so you really can’t go wrong.
UPDATE 8/14/2015: I’ve moved to an OpenVPN-based VPN (still hosted by my Synology Diskstation) and no longer need the proxy. I’ve added some instructions on how to get that working as well as how to make your Android device auto-connect to it when not on a trusted network.